
See where you can save.
Our Total Cost of Ownership (TCO) calculator gives you a fast, high-level view of your potential savings — based on real data from hundreds of fleet engagements.
Estimate Your Fleet’s Hidden Savings.
Slide to enter your total number of assets. We’ll show you a savings range based on what TFS has delivered for fleets just like yours – through optimization, invoice auditing and maintenance control.
We Do More Than Estimate Savings.
We Track Every Dollar.
Corporate Savings Tracker
Hard savings, cost avoidance and invoice corrections — tracked across every engagement to prove ROI year over year.

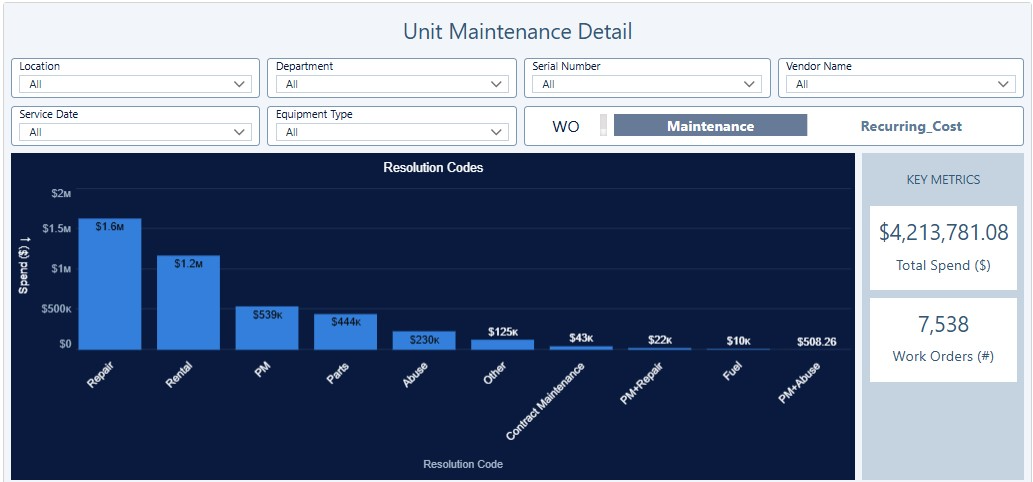
Unit Maintenance Detail (UMD)
Reveals hidden costs by tagging every maintenance event — from abuse to avoidable rentals — so nothing slips through.
Asset Overview Map
Shows exactly what’s leased, owned or rented — and where it all lives. Full visibility = smarter deployment and lower cost per hour. Gain custody and control of your fleet with 100% accurate inventory.

Schedule a Fleet Management Software Demo.
Schedule a live demo and discover how TFS turns insight into savings.